-
Coronavirus is spread between us via a variety of vectors (airborne, skin contact, faecal contact). It has also come to light1,2 that people showing no symptoms may play a major part in transmission; only isolating people that are showing symptoms does not make sense. Wide-spread testing will help to address this problem, but this is not happening yet.
-
Some advice suggests that banning meetings of 500 or 50 or 5 will be ok. These are arbitrary numbers with little scientific validation. Scientific consensus suggests that there is no safe number, but the lower the better (current government strategy seems to berisk reduction rather than elimination). See “The Korean clusters" or how just one person can tip the balance.
-
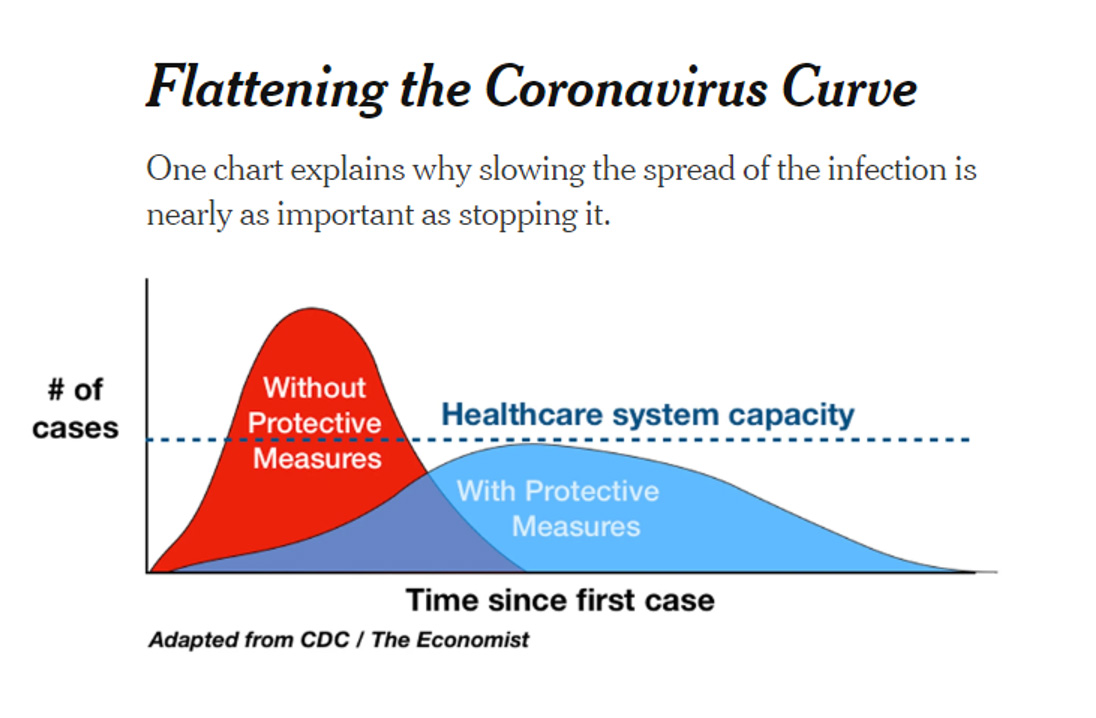
If we can slow down the virus spread rate then we can reduce the impact Covid-19 has on the NHS. See Fig. 1.
-
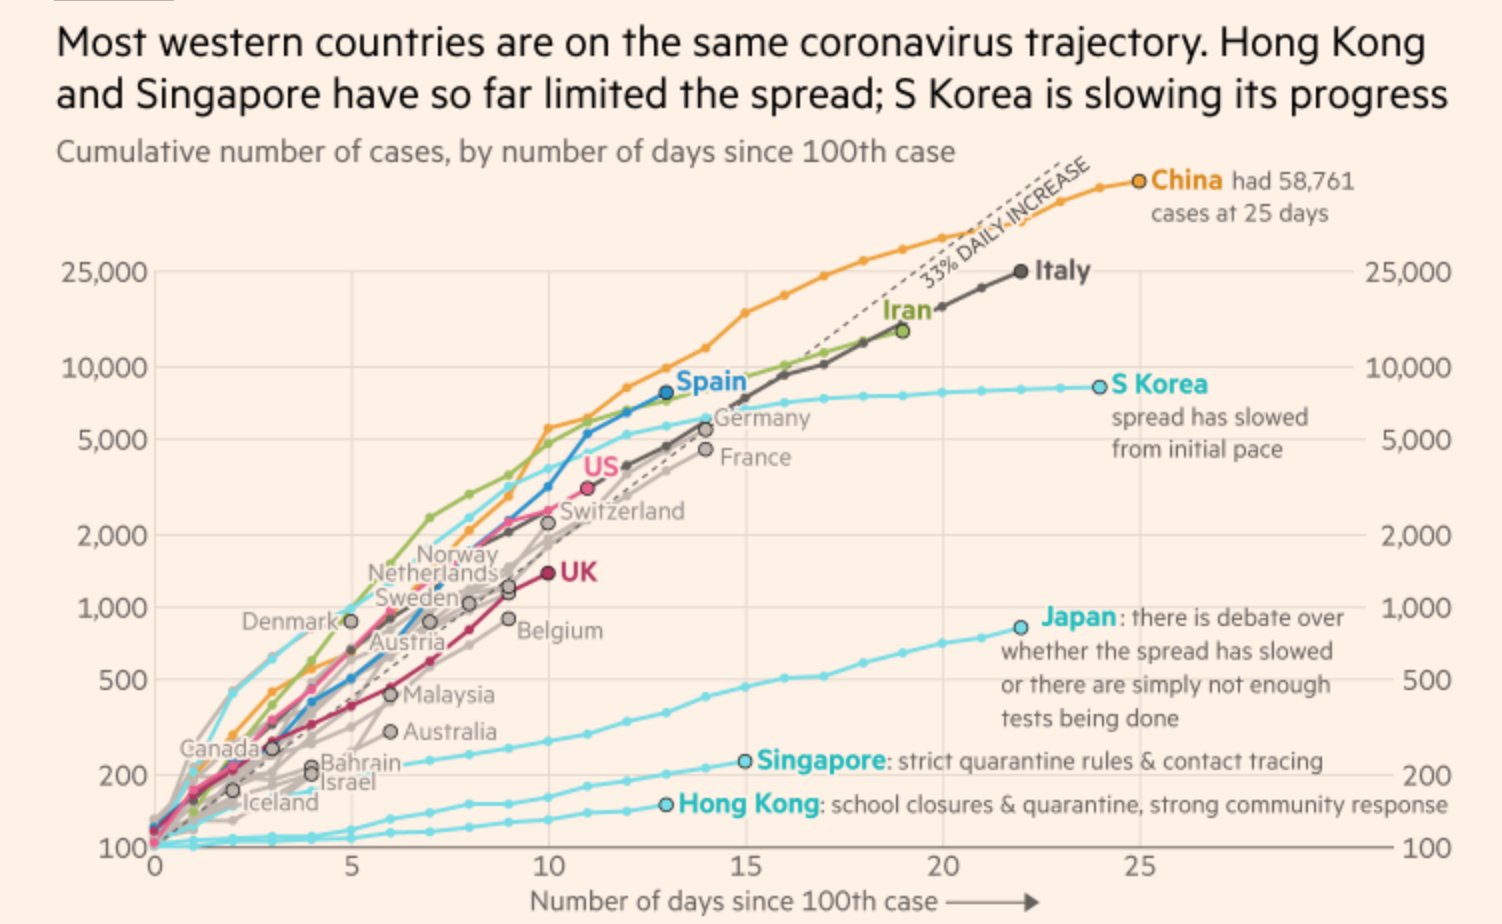
The countries (e.g. South Korea, Singapore, Hong Kong) showing the best flattening effects have gone for near total total isolation, countries (e.g. Italy) where people ignored social separation advice for too long have fared a lot worse. See Fig. 2.
-
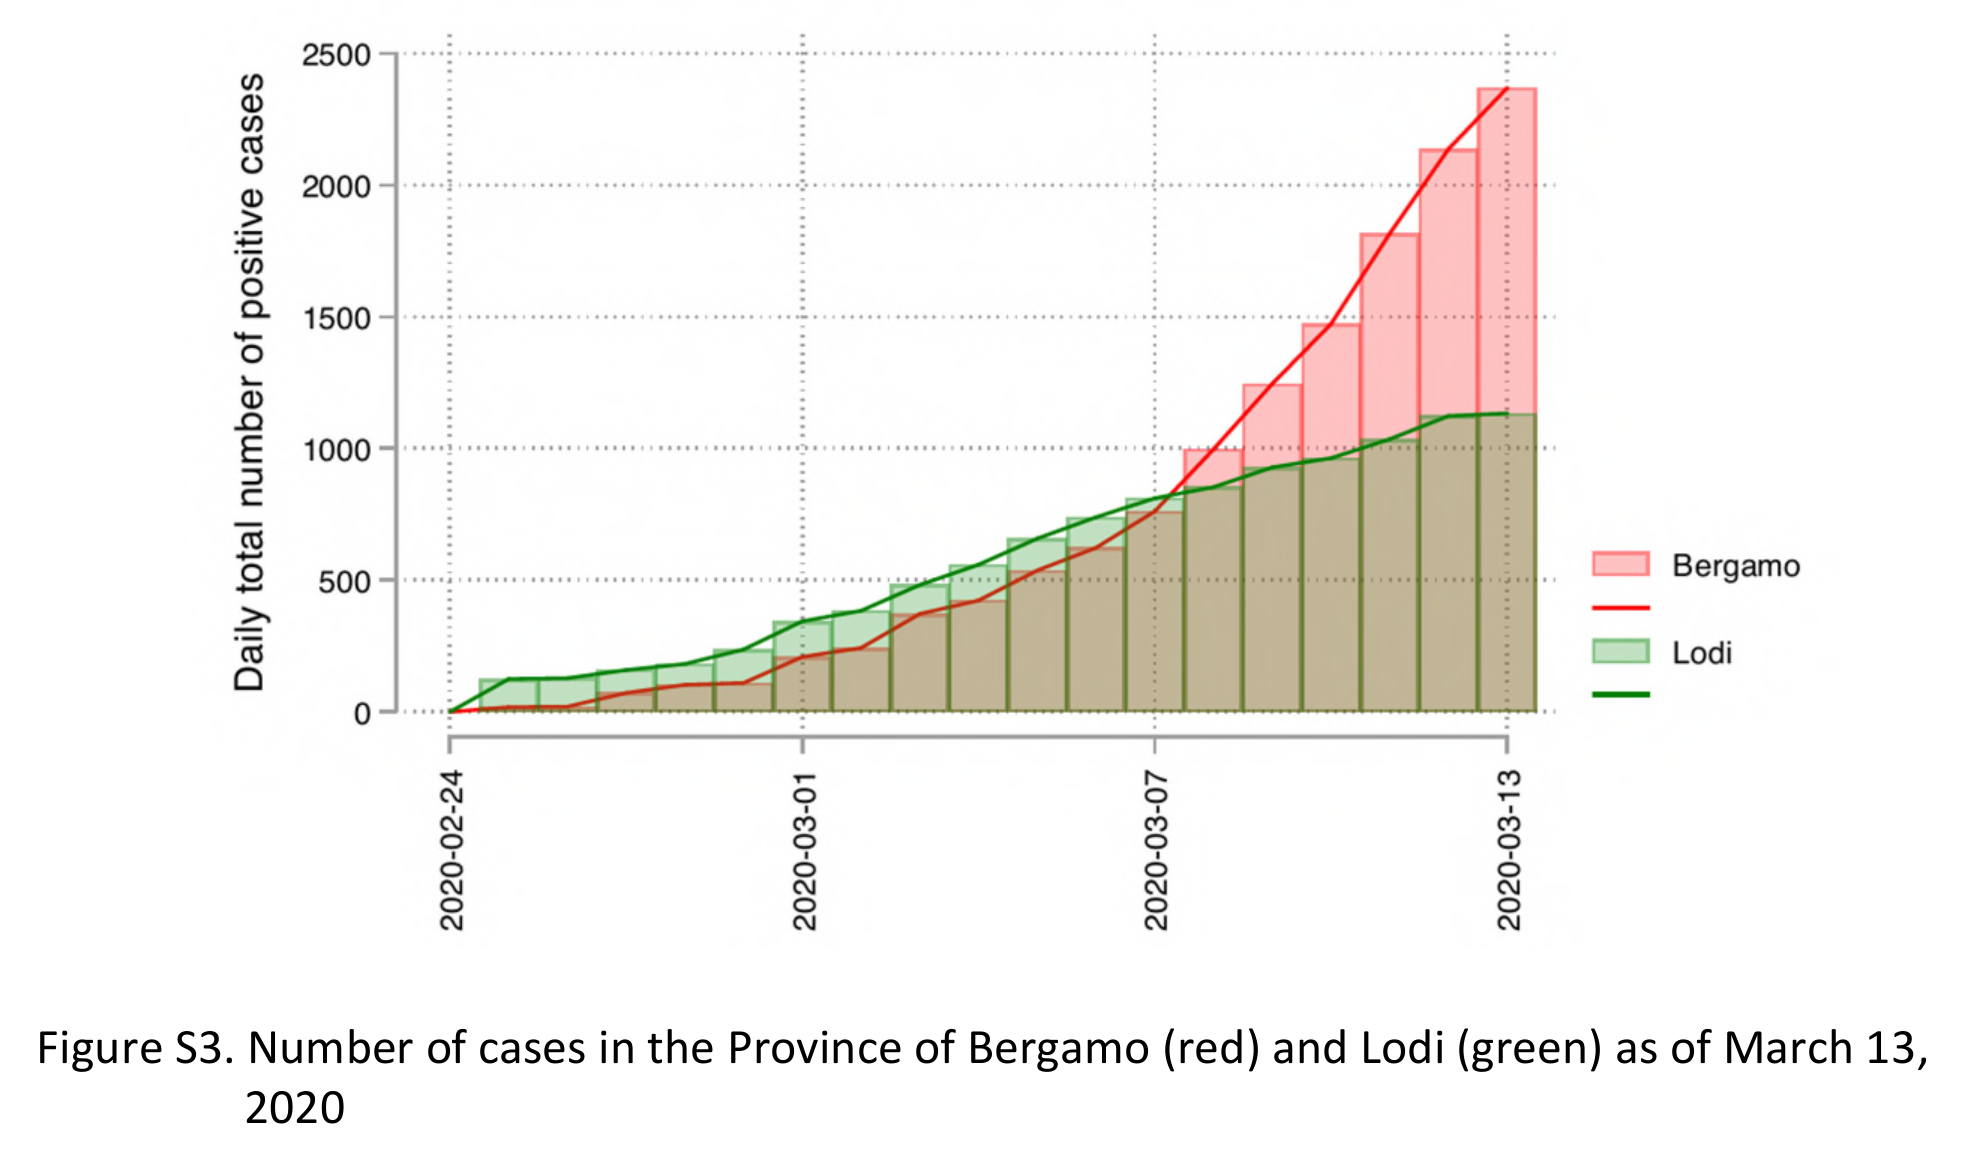
An example3 of how early social distancing versus late social distancing works is the difference between infection rates in two Italian areas: Bergamo and Lodi. Social distancing interventions were invoked on Feb 23rd in Lodi but not until March 8th in Bergamo, providing some recent empirical evidence for the potential of “flattening the curve” interventions. See Fig. 3.
-
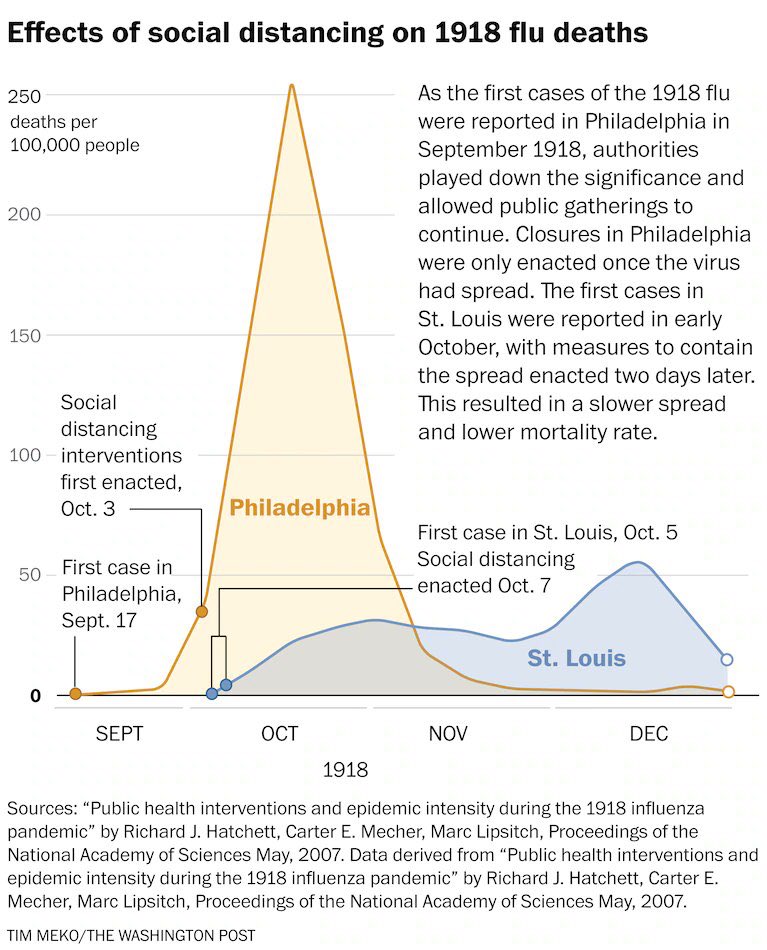
The effects of social distancing have been know about since the Spanish Flu pandemic in 1918/1919. In Fig. 4 the effects of cancelling (St Louis) and not cancelling (Philadelphia) a city parade can be seen.
1Tindale, L.C. et al, Transmission interval estimates suggest pre-symptomatic spread of COVID-19, medRxiv 6Mar2020, doi: 10.1101/2020.03.03.20029983
2Li, R. et al, Substantial undocumented infection facilitates the rapid dissemination of novel coronavirus (SARS-CoV2), Science 16Mar2020, doi: 10.1126/science.abb3221
3From Dowd, J.B. et al, Demographic science aids in understanding the spread and fatality rates of COVID-19, OSF 14Mar2020, osf.io/fd4rh/?view_only=c2f00dfe3677493faa421fc2ea38e295


